

The Fall of the Class of 2023
How our strongest cohort of fourth grade readers got clobbered by an education depression

In 2010, a new class of kindergarteners entered our public schools. Their timing was slightly unlucky. A massive global recession had just forced most states to make substantial cuts to education funding.
But these students thrived nonetheless. In fact, when they reached fourth grade in 2015, they posted the highest average reading scores ever on the National Assessment of Educational Progress (NAEP). Just look below. Maybe these are super children, we thought. Maybe we have invented super schools.1
The good times did not last. Something changed as these students moved through middle school. When they tested again as eighth graders in 2019, they were no longer the best readers we’d seen. Their performance was sharply worse than that of the eighth graders that tested just two years before.
All this happened before the pandemic. In March 2020, as this class was completing its freshman year of high school, COVID shut down schools nationwide. While there was local variation, all students spent some chunk of time doing ineffective online instruction and missing out on activities and friends.2
When this cohort graduated high school in 2023, its average SAT and ACT scores were noticeably worse than those of the classes immediately before it… even though those classes also suffered COVID disruptions.3 As college students, they have inspired a bottomless oeuvre of think pieces about their inability to read or write competently.4
It’s a first-to-worst situation. What happened to the fall 2010 kindergarteners that changed their course so dramatically?
I’m frustrated that after so many years of academic decline - confirmed once again by the recent release of the latest Education Scorecard - we don’t seem to know. Many possible causes have been debated. I’ve read my Jonathan Haidt, my Jean M. Twenge. I understand the theories about smartphones and social media. But the mechanics of how kids stopped learning as much have remained a little murky to me. Did they watch too many online videos and somehow become automatically unable to pass reading tests? If we don't find the right diagnoses for our problems, we're not going to solve them.

What to do? I realized we are sitting on heaps of data provided directly by the students behind the ugly stats. When kids take NAEP tests, they also complete 20-30 minute surveys covering a broad set of topics including classroom practices, school climate, access to resources, and engagement.
What if we mined the questionnaires this group completed as fourth and eighth graders? Would they help us understand how the 2010 kindergarteners were different from the students who entered school just before them?
I gave it a shot. The answer is yes. Students were communicating multiple warning signs that we didn’t see at first.
Here are four trends that stood out for me:
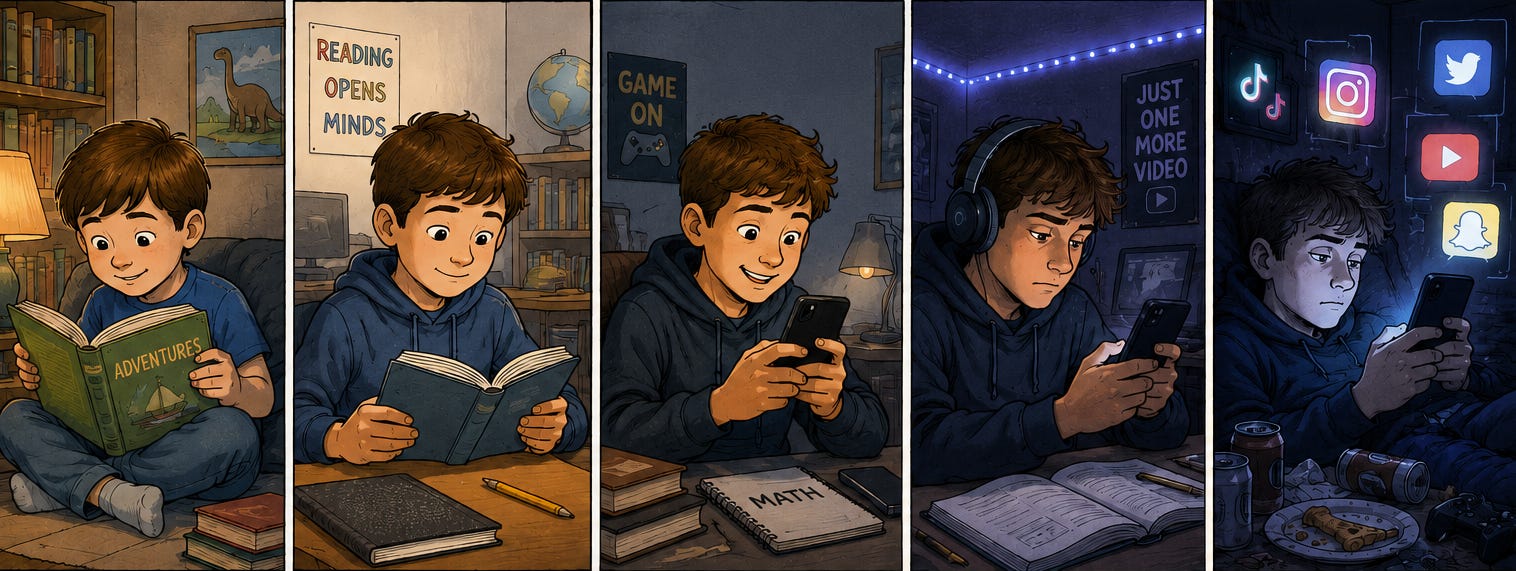
#1. Kids Began Reading Less Often for Fun
For the sake of simplicity, I’m going to refer to the fall 2010 kindergarteners as “the cohort.”
It’s true that cohort students were still scoring at record levels on NAEP reading as 2015 fourth graders. A big crack, however, was spreading in their foundation. Between 2011 and 2015, the share of fourth graders who said they read for fun “almost every day” dropped from about 46 percent to 38 percent nationally. In four years, America lost nearly one-fifth of its avid young readers. The graph below shows an abrupt decline after eight years of steadiness.
This trend was evident in 50 out of 50 states. In Massachusetts, which had the highest performing students on NAEP, daily reading fell by more than eleven percentage points.
It’s striking. Reading behaviors worsened everywhere and all at once. Habits don’t normally change that way. And yet fourth grade reading scores held fast… for the moment. That’s probably why we overlooked the trend at the time.
As the cohort reached eighth grade in 2019, its pleasure reading continued to lag. The NAEP questionnaire asked students “Besides doing homework, how much time do you spend reading outside of school?” The percent of respondents reading for 30 minutes or more each day fell from 40 in 2015 to 34 in 2019. The percent reading very little - less than thirty minutes per day - rose by roughly the same amount.
This time, as we saw above, the cohort’s reading scores were not as high as earlier groups. They mirrored the decline in reading for fun.
If out-of-school reading eroded before student achievement, it casts doubt on the likelihood that changes to instruction were the initial problem. If anything, good instruction may have temporarily filled gaps created by students reading less. And if out-of-school time is where our problems originated, maybe that’s where we need to focus our remedies first.
#2. Schools Leaned into Devices
Cohort students entered kindergarten the same year the iPad was introduced. Their elementary years coincided with the rapid rise of YouTube, smartphones, streaming video… the whole app-based childhood.
While I knew kids were obsessed with their screens outside of school, student surveys highlight how quickly screens ascended inside classrooms.
Between 2017 and 2019, the share of eighth graders who said they used laptops in “all or almost all” classes increased from 24 to 34 percent. Tablets entered the picture, too. In 2017, only 3.5 percent of students used them in “all or almost all” classes. In 2019, it was 15.4 percent. Daily internet use for homework went from roughly 40 to 60 percent. All that in two years.
During this time, there were basically two options for schools: fight to keep screens out of the classroom even though kids increasingly carried smartphones in their pockets and used tablets or laptops at home; or incorporate technology into instruction because of its perceived potential. Beat ‘em or join ‘em. Most did the latter. It probably seemed like a pretty easy choice. As a result, this cohort experienced significantly more school technology than students just a few years ahead of them.
#3. Schools Asked Less and Students Gave Less
As the cohort moved through elementary and middle school, homework became less common. In four years from 2015 to 2019, the share of eighth graders assigned thirty minutes or more of math homework each day decreased from 34 to 25 percent.5 The percent receiving no homework at all grew from 19 to 25 percent.
The next shoe to drop was daily attendance. The portion of eighth graders reporting two or more absences per month increased from 24.5 to 29 percent between 2015 and 2019, which is an 18 percent relative jump - and we cannot pin any of it on COVID.
Taking these trends together, we have a very clear indication that the culture of our schools had begun to change by 2015. One possibility is that they adapted to lower levels of student readiness - as well as the atomic distraction bomb of smartphones and social media - with softer expectations.
#4. State Tests Were De-emphasized
Eighth graders have long been asked to what extent their teachers prepare them for state assessments in reading. The response indicating the most preparation is “large extent.” In 2011, at the height of the No Child Left Behind era, almost 70 percent of students chose that option, making clear that tests were a major focus. By 2017, the figure dropped to 49 percent. It rebounded somewhat in subsequent years, but it has never cracked 60 again.
In other words, the students in this cohort spent much of elementary school during the period when schools were backing away from the intense test-prep culture of the No Child Left Behind era - a period when their learning also slowed.
I’m not claiming that testing by itself improves achievement. It’s a blunt tool. But these patterns challenge a common storyline. If excessive testing was a culprit that stole time from real teaching, we would expect achievement to improve as testing pressure receded. The opposite happened.
For folks who believe the 2015 passage of the Every Student Succeeds Act (ESSA) looks like a mistake in hindsight - and I’m among them - this survey data buttresses that point of view.
To sum up, students in this cohort told us they didn't read for fun as much, they were more surrounded by screens, they didn’t get as much homework, and their teachers were less focused on tests. And it all happened fast.
A Unified Theory of Everything
I’ve written about 40 posts since this Substack launched in September 2023. We’ve touched on many of these topics before, from declining test scores to reading habits to absenteeism. After sitting with so much data, it felt like the right time to pull together the strands into a broader thesis of what happened over the past 10-15 years.
Here’s my best shot:
There’s no single or even dominant cause of the long-term learning decline. The 2010 kindergarteners appear to have arrived in the early days of multiple, distinct changes, which we’ve reviewed above. Each one by itself might have been minor. Collectively, they created a measurably different developmental environment for children and adolescents in a brief period of time.
The common thread is effort. Reading a book requires sustained effort. Homework requires sustained effort. Showing up every day requires sustained effort. Preparing for tests requires sustained effort. These are ordinary habits that build a student’s mental capacity over time.
Adults throughout the system adapted as sustained effort from kids became more elusive to earn and maintain. Parents surrendered to screen time. Schools assigned less homework. States reduced accountability pressure. Colleges lowered entrance and grading standards.
It didn’t start with schools. It started at home. Unlike rock and roll or hip hop, screen adoption did not arise from youth culture. It was an adult thing. We’re the ones who lost the run of ourselves. Two economics papers just found that the 2007 arrival of the iPhone depressed fertility rates, for goodness’ sake. First, grown folks modeled screen infatuation and less reading. Then, young folks increasingly did the same. Subsequent changes schools made were understandable - perhaps unavoidable. And they came with a massive achievement cost.
This wasn’t an overnight collapse. That’s what made it easy to miss some of the patterns until COVID launched them into warp speed. Remember, the 2015 fourth graders were already reading less for fun, despite their impressive test scores. Eventually, those habits underneath the scores began to matter for achievement. Just not immediately.
This was the first cohort shaped by so many new forces at once. They entered school at the tail end of an accountability era that produced gains, particularly for struggling students. By the time they graduated, we were squarely in an education depression.
My point is not that we need to return to 2010. Not an option, obviously. It is that the basics still matter. That never changed. The high school class of 2023 is a cautionary tale of what happens when the basics falter.
Next year, in 2027, this class will begin to graduate college. I will be surprised if we don’t see an uptick in headlines about employers who are alarmed at the lack of readiness in their new hires.
And here’s the thing: as new cohorts have come through fourth grade since 2015, every one of them has scored lower than the last on NAEP reading. It’s been four consecutive batches of bad news. We know the long-term consequences of weaker literacy will be working their way through our school systems for years to come.
It’s time for us to get serious about rebuilding student attention and effort - or we will be trapped in this new normal where we accommodate challenges instead of addressing them. We need to lead the way as adults by modeling behaviors we want our kids (and students) to emulate. If we scroll endlessly and never sit with a book, there’s no reason they won’t follow suit.
Not to change the subject, but has anyone seen my library card…?
I’m kidding. We did not actually think this. The New York Times coverage of 2015 NAEP results was all doom and gloom… because math dipped slightly. We had no clue how bad the next decade was going to be. What we wouldn’t give for those 2015 NAEP scores today.
Michael Petrilli led the way in exploring these questions last fall - strongly recommend reading his post on the subject.
For my data wonks, both SAT and ACT scores experienced a national decline of about 0.20 SD from 2019 to 2023. Some of this is certainly directly attributable to COVID disruptions, of course, but the downward trajectory of achievement was already well-established before the pandemic.
There are too many examples to cite just one. A sampler:
The Atlantic: The Elite College Students Who Can't Read Books
Chronicle of Higher Education: Is This the End of Reading?
Minding the Gap- Natalie Wexler: The College Kids Are Not All Right
Education Next - Michael J. Petrilli: Seven Thoughts about Elite College Students Who Can’t Read Books
This downward trend persisted - by 2024, just 18 percent of eighth graders reported 30 minutes or more of math homework per night.
I don't think we can understand the causes of declining test scores without looking at the international trend, the trend of cognitive decline in adults who are out of the workforce, and the reversal of the Flynn effect. This isn't specific to school, it's something much bigger. I'd love to see an analysis comparing those different sources of data. The extent to which US schoolchildren differ from those bigger trends sounds interesting, but I haven't seen anyone dive into it.
This isn't an abdication of schools' responsibility. I think schools can and should do better. But if we run around chasing a cause of declining test scores in schools when the cause is actually outside of schools, that could distract us from all the stuff that we can control.
You are hesitant to push more blame onto screens. Why?
Especially because you write that "There’s no single or even dominant cause of the long-term learning decline," but then cite two reasons -- kids reading less for fun and more devices in schools -- that support the theory that the decline is mostly screen.
And write that "the mechanics of how kids stopped learning as much [due to screentime] have remained a little murky to me. Did they watch too many online videos and somehow become automatically unable to pass reading tests?" but, again, cite two reasons -- kids reading less for fun and more devices in schools -- that indicate pretty clearly how screentime negatively affects students' ability to read.
AND you conclude your essay, for goodness' sake, with this: "We need to lead the way as adults by modeling behaviors we want our kids (and students) to emulate. If we scroll endlessly and never sit with a book, there’s no reason they won’t follow suit."
Tim! My friend! It is mostly the screens! Around 2010, we -- all of us -- started spending WAY too much time in front of screens. When parents themselves are constantly on their phones or watching TV, what do you think happens to their children developmentally? When children are staring at screens more in school and out of school what do you think happens to them developmentally? Streaming, social media and gaming have made it both easier AND more desirable to stay home and not go to school (or go out and play.) Hence the absenteeism.
In 15 years we have allowed screens to disrupt our homes, our families, our schools and our public spaces. We are fully surrounded by and fully distracted by screens. (And that's not even considering the mindless, unredeemable content that most people look at on those screens.)
It's the screens, dude.